
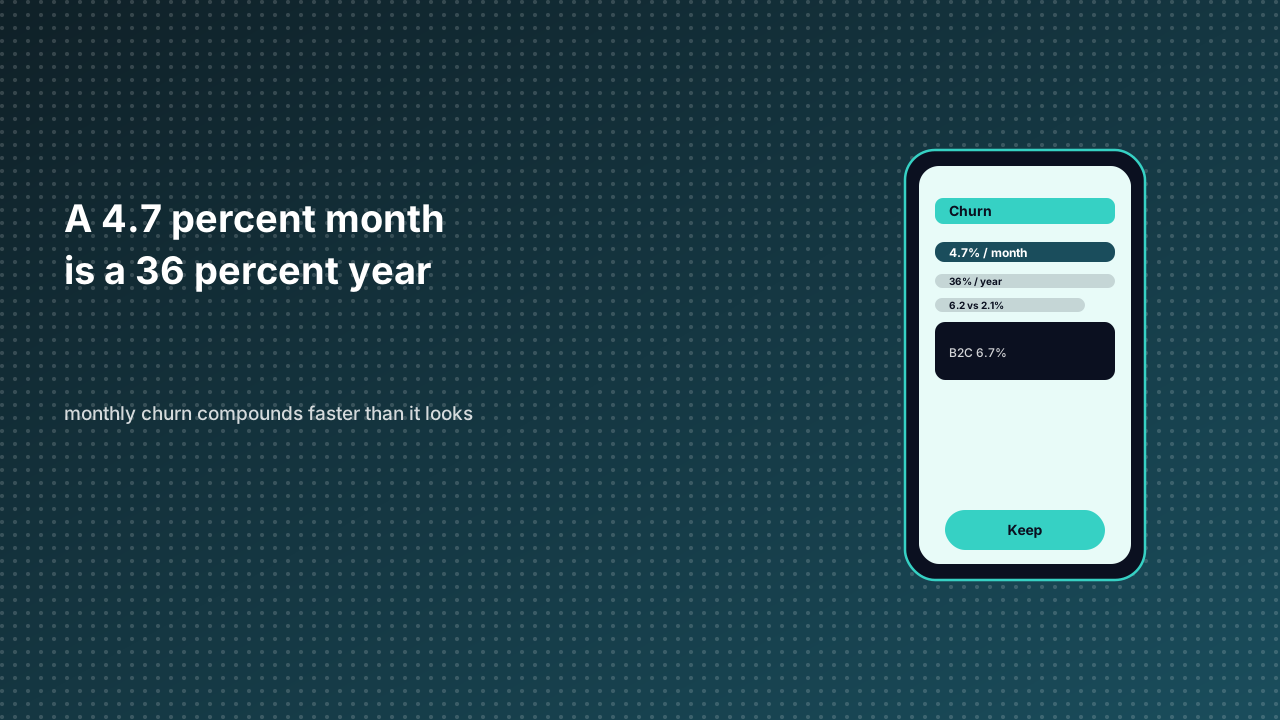
Five percent monthly churn sounds survivable. It is not. Because monthly rates compound, 5% a month removes roughly 46% of revenue over a year, and the median SaaS company at 4.7% monthly ends up near 36% annual churn. The arithmetic is why small monthly differences matter far more than they look on a dashboard: moving from 5% to 4% is not a one-point improvement, it is close to ten points of retained annual revenue.
The benchmark depends entirely on who is being measured. ChurnTools puts the overall SaaS median at 4.7% monthly, with B2B at 3.9%, B2C at 6.7%, and enterprise at 1.5%. By industry, cybersecurity runs 2.9% monthly and fintech 3.2%, where switching creates compliance risk and lock-in; edtech runs 7.8% and media 7.2%, where individual users are price-sensitive and fickle. Company size is an even stronger predictor: enterprise contracts above $50,000 ACV churn at 0.5–1.5% monthly, mid-market at 2–5%, SMB at 3–7%, and micro or prosumer products under $500 at 6–12%. A 5% rate is catastrophic in one segment and unremarkable in another.
| Segment | Monthly churn | Typical annual equivalent |
|---|---|---|
| Enterprise ($50k+ ACV) | 0.5–1.5% | 6–17% |
| Mid-market ($5k–50k ACV) | 2–5% | 22–46% |
| SMB ($500–5k ACV) | 3–7% | 31–58% |
| Micro / prosumer | 6–12% | 52–78% |
| Cybersecurity vertical | 2.9% | about 30% |
| Edtech vertical | 7.8% | about 62% |
Contract structure moves the number more than most product work. RevMine's analysis of 500-plus companies found monthly billing at 6.2% median churn against 2.1% on annual billing, a 60–70% reduction that comes from having one decision point per year instead of twelve. Usage-based pricing sits at 4.5% and freemium-to-paid at 5.4%. The caveat matters: annual contracts suppress measured churn without necessarily eliminating the underlying dissatisfaction. Customers who do not renew on annual terms show the same usage warning signs as monthly customers who leave — the signal is simply delayed by twelve months. A platform that only watches contractual churn will find out late.
The most credible early indicator is product usage. Login frequency drops, key features go unused, and support tickets shift from "how do I" to friction or absence. Churn analysis across multiple datasets points to the first 14 days as disproportionately decisive, which makes time-to-value the practical metric: how quickly a new user reaches the moment where the product clearly delivers on its promise. Weak onboarding is consistently cited as the most frequent early-stage driver, ahead of price and ahead of features. There is also a survivorship bias in published benchmarks — companies with terrible churn rarely survive long enough to appear in surveys — so an external median is a sanity check, not a target. The own trend line, quarter over quarter, is more actionable.
Churn also has two denominators that get conflated. Logo churn counts customers who cancel; revenue churn counts the recurring revenue lost to cancellations and downgrades. Losing one $10,000 account hurts more than ten $100 accounts, even though logo churn reports the opposite. Revenue churn is usually the more honest picture, and it is the input that belongs in LTV and payback calculations. A merchant platform that reports only logo churn can look stable while its highest-value merchants quietly shrink.
Embedded distribution changes both denominators in ways that are easy to overstate. The host's discovery surfaces lower the cost of replacing a churned merchant, which makes logo churn less lethal to the platform — but that is a mitigation, not a fix, because replacement merchants still have to reach payback. What the runtime genuinely improves is time-to-value. A storefront activated inside a host app inherits identity, payment rails, and an existing audience, so the gap between signup and first transaction is days rather than the weeks a standalone integration requires. Given that the first 14 days decide so much, compressing setup is a direct churn intervention. Usage telemetry from the runtime also makes the warning signs visible early: transaction volume, active buyers, and module adoption can trigger an intervention before the renewal conversation, rather than after a cancellation notice.
The measurement discipline for a host platform is to report revenue churn and logo churn side by side, segmented by merchant size and by acquisition source, with a separate view of "would-be churn" — active accounts that show no expansion and no engagement. Annual and monthly cohorts should be tracked separately, since a contract structure that halves measured churn can still hide the same underlying dissatisfaction. The runtime supplies the behavioral data that makes those views possible. Whether the platform acts on the early warnings is a separate question, and usually the more expensive one.
Sources
- SaaS churn rate benchmarks — overall, industry, size, and pricing-model medians.
- Churn benchmarks from 500+ companies — segment and industry data, annual vs monthly billing.
- SaaS churn analysis and cohort tracking — segment thresholds and early-warning indicators.
- SaaS churn rate 2025 benchmarks — compounding math and survivorship bias.