
Inventory is where working capital goes to hide. A business can post strong revenue and still run out of cash because too much money is sitting in boxes that have not sold. The number that exposes the problem is inventory turnover — how many times a year the average stock is sold and replaced — and its companion, days inventory outstanding (DIO).
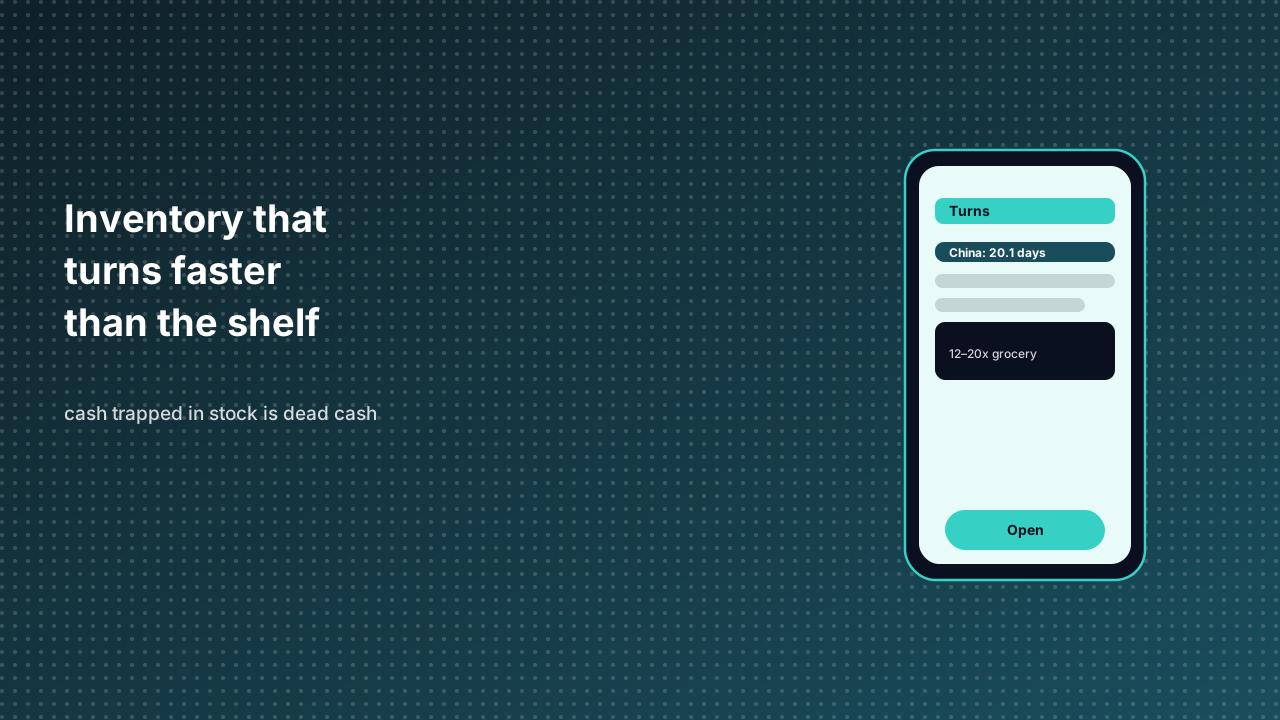
Benchmarks differ sharply by category. Grocery and fast-moving consumer goods turn 12 to 20 times a year, holding 18 to 30 days of stock. General e-commerce and direct-to-consumer brands turn 4 to 8 times, or 46 to 91 days. Apparel sits at 4 to 6 turns, 61 to 91 days. China's statistics bureau reports that above-scale wholesale and retail enterprises held inventory for 20.1 days on average in 2024, down 2.2 days from 2020 — a sign of how much cash flow improves when turnover tightens.
The carrying cost is the silent tax. Industry models put annual inventory carrying cost at 20 to 30 percent of the inventory's value. A brand with $500,000 in average inventory turning 2.5 times holds roughly $200,000 more stock than a healthy 6-turn operation, costing about $50,000 a year in pure holding expense before any obsolescence or shrinkage. The other failure mode is the opposite: a ratio above 10 for a non-grocery business usually means stockouts. Harvard Business Review research finds that 21 to 43 percent of customers who hit a stockout simply buy from a competitor.
| Segment | Annual turns | Days inventory | Typical gross margin |
|---|---|---|---|
| Grocery / FMCG | 12–20x | 18–30 days | 25–30% |
| General e-commerce / DTC | 4–8x | 46–91 days | 40–60% |
| Apparel / fashion | 4–6x | 61–91 days | 50–65% |
A mini-program changes the mechanics in two ways. First, it links the storefront directly to inventory that lives in the host's or merchant's system, so stock levels shown to a shopper reflect what is actually available across every outlet. A customer scanning a code in one branch sees real-time availability at another. Second, the same transaction stream that powers checkout becomes the demand signal that drives replenishment, replacing the lagged, spreadsheet-based forecasts that let slow SKUs hide behind fast ones.
The payoff is fewer extremes. Dead stock — the C items turning below 1x — gets flagged by the same data that surfaces the A items at stockout risk, so purchasing decisions stop averaging two problems into one comfortable lie. For a host running a catalog of third-party mini-programs, the principle extends upward: catalog breadth is not inventory the host owns. The host earns on transactions without carrying the boxes, which means turnover becomes the merchant's discipline, not the platform's balance-sheet risk.
The caution is that faster is not automatically better. Cutting DIO to zero invites the stockouts that cost 21 to 43 percent of would-be buyers. The goal is the fill rate above 97 percent that lets a lean ratio actually pay off. A mini-program makes that target reachable because the data loop is continuous rather than monthly, and the storefront and the stockroom finally speak the same language in the same second.
Sources
- Inventory turnover ratio benchmarks — category turns, DIO, carrying cost 20–30%.
- China wholesale and retail inventory days 2024 — 20.1 days average, down 2.2 from 2020.
- Stockout customer behavior (HBR cited) — 21–43% buy from competitor on stockout.
- Retail inventory benchmarks by category — FY2024 public-company medians.