
A planning meeting has four teams, four dashboards, and four defensible definitions of progress. Design wants completion rate, growth wants installs, finance wants margin, and support wants fewer tickets. Each number is real. None of them can end the argument, because each one improves while the others quietly get worse.
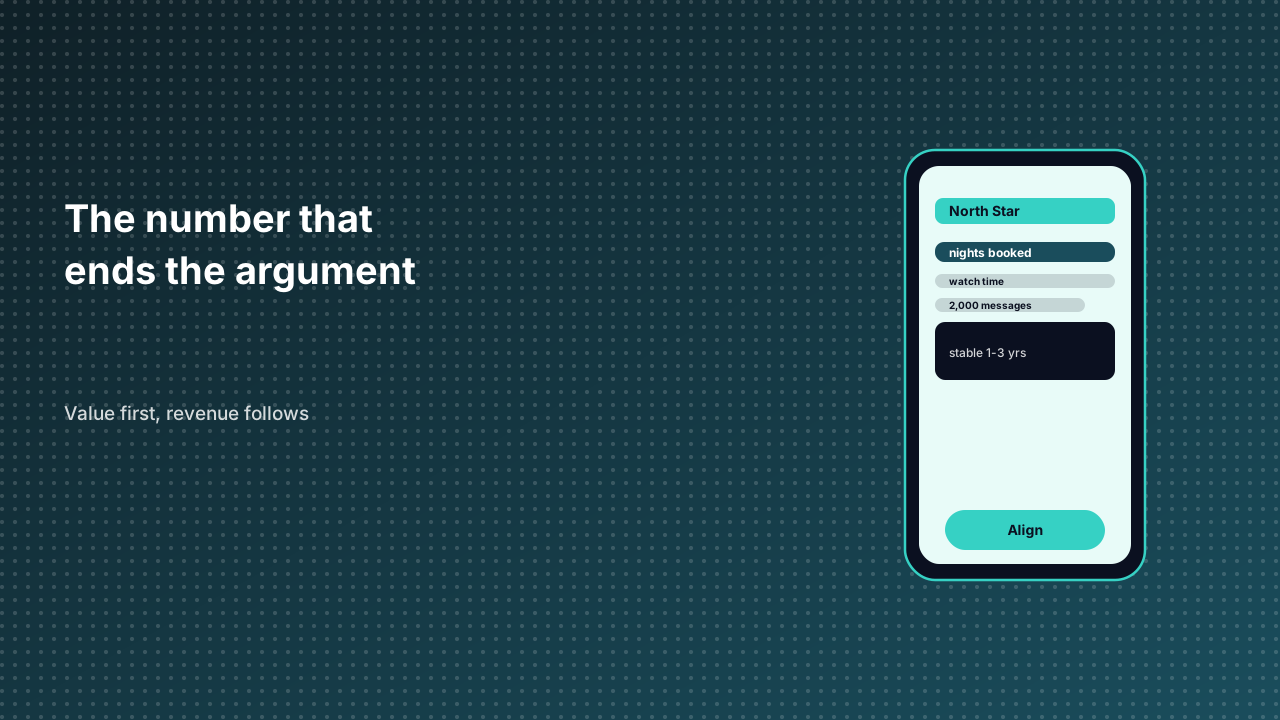
Sean Ellis coined the term north star metric for exactly this problem: one measure that captures the value customers actually receive, and that a whole organization can pull in the same direction. The examples are famous because they are specific. Airbnb settled on nights booked. Netflix chose watch time rather than subscriber count. Spotify tracks time spent listening. Slack watches messages sent per team — teams passing roughly 2,000 messages almost always convert. Facebook built its early compass out of daily over monthly active users.
Three tests before a number qualifies
A candidate has to do three jobs. It must reflect customer value rather than company activity; it must lead revenue rather than trail it; and teams must be able to move it within weeks, not quarters. A metric that fails the first test is a vanity metric. Registered users and download counts are the classic offenders: both go up when marketing spends money, and neither says whether anybody got anything out of the product.
Failing the second test is subtler. Revenue is a lagging indicator; by the time it moves, the decisions that caused the move are long made. A north star should be an early warning system, not an autopsy. Failing the third test produces a number that everybody admires and nobody can influence — the organizational equivalent of a decorative clock.
The compounded version is worse. A blended score that folds eleven signals into one figure looks rigorous and behaves like fog. When the score moves, nobody can say which input moved it, so nobody can act.
| Company | North star | What it deliberately ignores |
|---|---|---|
| Airbnb | Nights booked | Listing count, page views, signups |
| Netflix | Watch time | Subscriber totals, marketing reach |
| Spotify | Time spent listening | Download counts, playlist follows |
| Slack | Messages per team | Installs, seats provisioned |
| Daily over monthly active users | Raw registration volume |
The dashboard paradox
Here is a nuance that gets lost in most north-star write-ups. Choosing one number does not mean tracking one number. The working range for a core metric dashboard is five to nine measures; beyond that, teams slip into decision paralysis and start optimizing whichever chart is currently red. The north star sits at the top, three to five input metrics sit beneath it, and each input belongs to exactly one team.
The time horizons matter too. A north star stays stable for one to three years — long enough that people learn how the business actually moves it. Input metrics get reviewed quarterly, because those are the levers teams can realistically change. Treating the north star like a quarterly target turns it into a number that gets gamed; treating inputs like permanent doctrine stops anyone from experimenting.
When the metric becomes the product
The honest critique is that a single number eventually gets optimized to death. Once a team knows that watch time is the score, it can surface longer content even when shorter content serves people better. Measure nights booked hard enough and supply may tilt toward quantity over quality. The north star is a compass, not a moral framework, and every compass needs a guardrail beside it — refunds, complaints, or repeat purchase that flag when the score is being won at the expense of the thing it stands for.
That is why the best metric choices are boring ones. A number that is hard to fake and easy to explain survives pressure; a clever one collapses the first time a bonus is attached to it. A metric that requires a slide to justify will lose every budget argument to one that fits in a sentence.
What this looks like inside a host app
A mini-program's north star has to make sense to the host app carrying it, because the host controls discovery and distribution. A metric built on sessions alone will flatter a mini-program that people open once and never act on; a metric built on completed bookings, sent messages, or repeat purchases translates into value the host can recognize. That shared language is what earns placement, not a prettier dashboard.
A runtime that spans several hosts can report the same north star across each one, so a team sees whether the number is genuinely moving or just migrating between host audiences. Pick one number, defend it for a couple of years, and let every other metric earn its place underneath it.
Sources
- What is a north star metric — hellopm.co — a clear introduction to one-number focus.
- North star metric guide — sigos.io — how to choose and validate a candidate metric.
- Choosing a north star metric — canelmas.com — practical tests and common anti-patterns.
- North star examples — hellopm.co — the company cases behind the familiar numbers.