
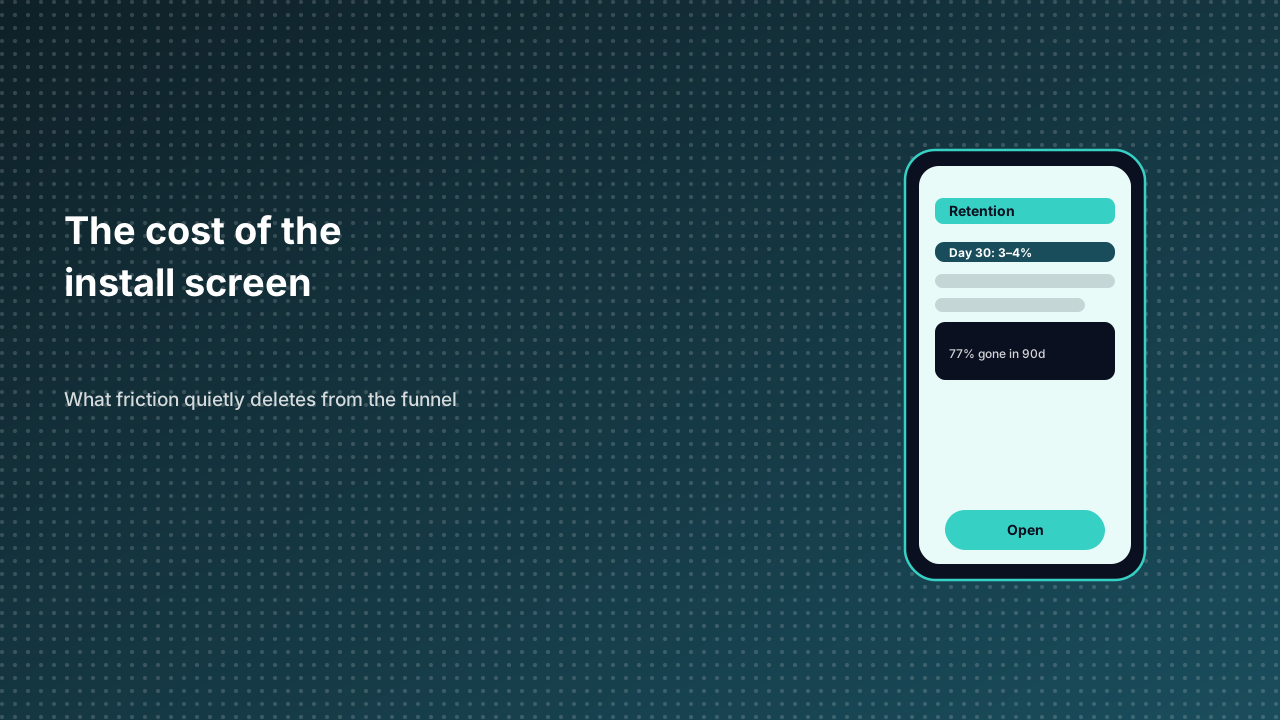
Most growth discussions start with acquisition cost. The bigger leak is what happens after the icon lands on the home screen. Industry retention benchmarks for 2025 are brutal: the average mobile app keeps only 3–4% of its users by day 30, and more than 70% of users are gone within the first 30 days of install. A data.ai report cited across the industry puts the 90-day uninstall figure above 77% — only about 23% of downloaded apps survive three months. AppsFlyer's 2025 benchmarks land in the same range, with blended day-30 retention hovering near 28% and most categories far below that.
The cause is structural, not cosmetic. The install step is a tax on intent. A user has to find the app in a store, approve permissions, wait for a download, open it, and then decide whether the first session was worth the effort. Research on first-session behaviour shows the median new user spends under four minutes in an app before forming a verdict, and half of all uninstalls happen on day one. Every one of those steps is a place to quit. The acquisition budget pays for the download; the product then has to defend that download against its own onboarding.
Why the install screen is the most expensive screen
The economics get worse as acquisition costs rise. eMarketer and industry projections put the average cost per install above $5 across competitive categories by 2026, with gaming and finance already in double digits. That means an operator is paying $5 or more to place an icon that three out of four users will delete within three months. Retention effort is then spent on win-back — the lowest-leverage activity in the entire funnel, because recovering a departed user costs more than never losing them.
A frictionless entry point inverts this. When a service is reachable without an install — through a chat thread, a QR code, a search result, or a shared link — the intent-to-action gap collapses. There is no permission wall, no download wait, no home-screen commitment. The user either finds value in the first session or leaves, but the cost of that trial is near zero, and the path back is one tap rather than a reinstall. The same first-session quality that converts 3–4% of installers can convert a far larger share of casual entrants, because the barrier to trying was never there.
| Lever | Native app install | Frictionless mini-program entry |
|---|---|---|
| Step before value | Store search → install → permissions → open | Tap link / scan → open |
| Day-30 retention baseline | 3–4% (blended average) | Higher: entry tied to existing intent |
| Cost of a failed trial | Lost $5+ CPI + reinstall friction | Near zero, re-entry is one tap |
| Best retention lever | Win-back campaigns (low leverage) | Remove the install step (prevents loss) |
The compound effect on lifetime value
Retention compounds where acquisition does not. A 5% improvement in retention has been shown to move revenue more than most acquisition campaigns, because retained users convert, refer, and expand. The mini-program model captures this by treating entry as free and repeat entry as a default. A user who tried a ride, a payment, or a game and left can be pulled back through the same channel they arrived from, without the operator paying to reacquire them.
The mistake operators make is modelling the catalog as a distribution expense. The real return is in the retention curve: fewer users lost at the install screen means a larger base surviving to day 30, and that base is what monetization and cross-sell actually act on. A catalog with frictionless entry is not a cheaper storefront. It is a retention engine wearing a storefront's clothes.
What the data says about the entry point
The pattern repeats across every market where mini-program entry has matured. Super-app internal data consistently shows multi-service users transact 3–4x more than single-service users, and that effect is downstream of easy re-entry, not just breadth of features. The cheaper it is to come back, the more often users do. The install screen is where most of that coming-back is killed in the native model.
Sources
- AppsFlyer App Retention Benchmarks 2025 — industry day-30 retention ranges and category breakdowns.
- Engagelab — Increase Mobile App Retention — benchmarks citing AppsFlyer 2025 and Mixpanel data, milestone retention tables.
- App Launch Partners — App Retention Crisis 2025 — 72–77% 90-day uninstall figures and first-session drop-off.
- Adapty — Mobile App Growth Strategies 2026 — CPI trends toward $5+ by 2026 and retention-to-LTV relationship.