
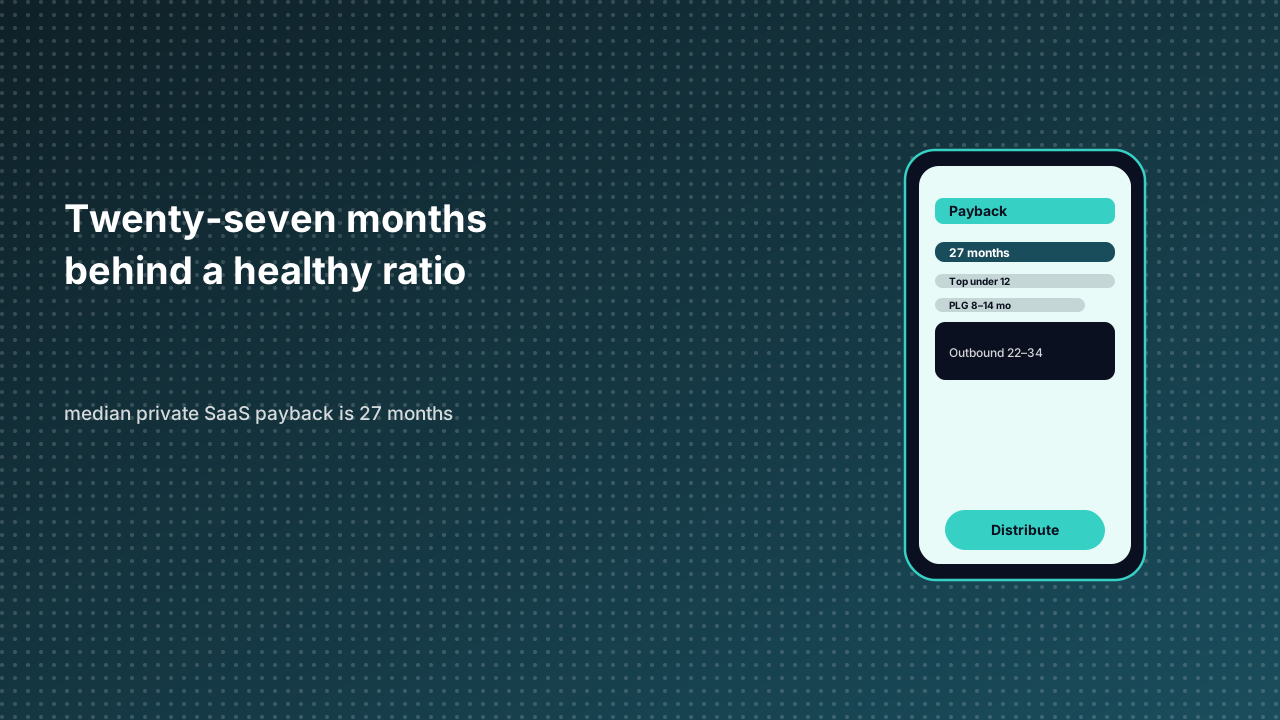
A company can show a respectable 3:1 LTV-to-CAC ratio and still run out of cash. The ratio is built on a lifetime assumption; payback is built on a calendar. Bessemer's State of the Cloud 2025 puts the median SaaS CAC payback at 27 months, with top-quartile companies recovering acquisition cost in under 12. When the funding environment assumed the next round would arrive before the money ran out, 30-month payback was tolerable. Investors now model the current round lasting 24 to 36 months, which turns anything above 18 to 20 months into a genuine capital risk.
Payback is the number of months of gross margin required to recover the fully loaded cost of acquiring a new customer. The formula is CAC divided by new MRR per customer times gross margin — and the emphasis belongs on gross margin. Revenue payback flatters the number by ignoring what it costs to deliver the service. Benchmarkit's 2025 report puts the median B2B SaaS payback at 15 months, while KeyBanc's survey breaks it down by segment: SMB-focused companies around 8–12 months at the median, mid-market 12–18, enterprise 18–30, and a blended figure of 15–18. Company stage matters as much as segment. Businesses below $1 million ARR average 38 months, roughly 3.5 times the 11 months reported by companies above $100 million ARR.
| Segment | Median payback | Top quartile |
|---|---|---|
| SMB-focused SaaS | 8–12 months | under 6 |
| Mid-market SaaS | 12–18 months | under 10 |
| Enterprise SaaS | 18–30 months | under 15 |
| All SaaS, blended | 15–18 months | under 12 |
| Under $1M ARR | about 38 months | — |
The math between the two headline metrics is direct. At a 3:1 LTV-to-CAC ratio and 75% gross margin, payback lands near 16 months assuming flat revenue per customer; a 5:1 ratio at the same margin implies roughly 10 months. Low gross margin stretches payback even when the ratio looks healthy, which is why AI-native products carrying inference costs in COGS are being watched more closely. Rule of 40 scores and payback are structurally linked: a company growing 35% with a negative 5% free cash flow margin scores 30, below threshold, and a 22-month payback explains why the capital is being consumed. Compress payback to 12 months on the same growth rate and the freed cash either reduces burn or funds more acquisition at the same budget.
Calculation errors are common and can move the number by half. Using total ARPA instead of new-customer ARPA credits expansion revenue from mature accounts to the economics of a fresh cohort, which understates payback. Blending new-logo CAC with expansion and renewal CAC hides the fact that new logos are structurally more expensive. Commission timing creates artificial monthly volatility when a payment lands in a different period from the customers it helped acquire. And operating teams too often quote revenue payback where investors expect the gross-margin-adjusted version, which is not a rounding difference.
Distribution model is the lever most teams underrate. Bessemer's data shows product-led-growth companies recovering acquisition cost in 8–14 months against 22–34 for outbound-heavy SDR models. The mechanism is not magic: a product that spreads inside an existing account acquires the next seat at a fraction of new-logo cost, and self-serve onboarding removes much of the sales cycle. Investor thresholds now reflect this. Series B expects payback under 15 months with a 3:1 ratio floor, Series C under 12 with a 4:1 target, and growth equity under 10.
Embedded distribution attacks the numerator in the same way, but through the channel rather than the product. A merchant launching inside a host app does not pay for cold traffic from scratch; the host's existing users, search, and recommendation surfaces supply discovery. That does not make acquisition free — onboarding, catalog integration, and support still cost money, and a share of revenue goes to the host — but it converts a paid-acquisition line into a lower fixed-cost motion. The honest way to model it is to count the full host fee and the integration cost into CAC, then measure how much faster the gross margin on each new merchant covers it. Where a standalone app might carry 20 months of payback, an embedded storefront can plausibly reach the sub-12-month band that Series C investors now expect.
The measurement discipline is to separate new-merchant payback from expansion payback inside the same platform. A host that reports blended numbers will mistake cheap seat expansion among established merchants for efficient acquisition of new ones. For a runtime platform, that distinction is existential: the catalog only compounds if new merchants reach payback quickly enough to keep joining, while existing ones expand on top. The reporting layer should show both, calculated on new-cohort gross margin, with the host fee included. Anything less produces a growth story that survives a board deck and fails a cash-flow test.
Sources
- CAC payback formula and benchmarks — gross-margin-adjusted formula, segment and ARR-stage medians.
- LTV:CAC ratios across verticals — Bessemer 27-month median, PLG vs outbound payback.
- Payback benchmarks by funding stage — KeyBanc segment data and investor thresholds.
- Board-level marketing metrics — fully loaded CAC and definition discipline.