
A growth lead opens the dashboard after a three-week test. The variant is down four percent, the confidence bar reads seventy-one percent, and someone has already started drafting a postmortem about a bad idea. The real mistake happened at kickoff, though, when the team decided that a seventy-one percent read counted as a result at all.
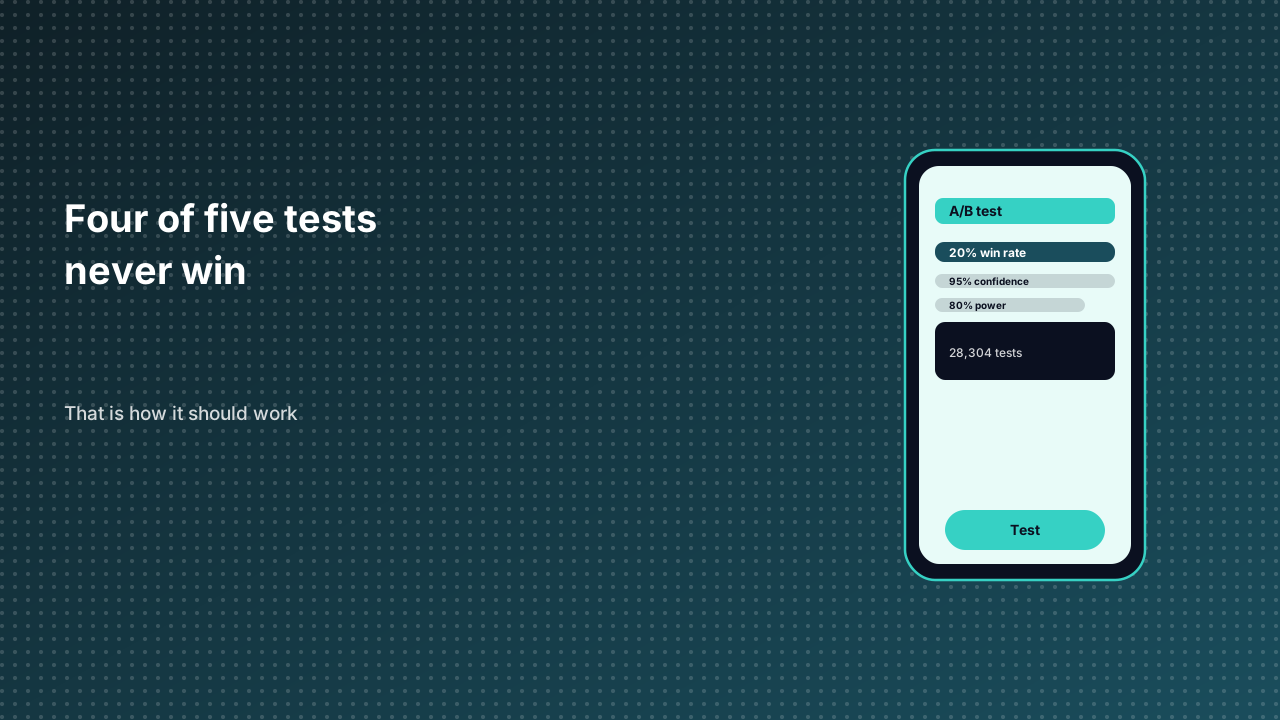
CXL analyzed 28,304 experiments run through Convert.com and found that only about one in five reached ninety-five percent significance; more than half produced no measurable lift at all. The statistic gets wheeled out as proof that testing is theater. Read properly, it is a description of how uncommon genuine wins are, and of how much patience an honest testing program requires.
The arithmetic everyone skips at kickoff
The standard bar is ninety-five percent confidence with eighty percent power, which puts the critical values at Z equals 1.96 and 0.84. Translating that into traffic is where enthusiasm usually dies. With a baseline conversion rate of two percent, detecting a twenty percent relative lift — up to 2.4 percent — takes roughly 20,000 visitors per variant, or about 40,000 in total. A team seeing a thousand visits a week is not running a two-week test; it is running a two-month test and calling it a fortnight.
Most experiments land in the 1,000 to 10,000 visitors-per-variant band, which is why the practical minimum sits at two to four weeks. Shorter windows do not speed up learning. They recycle the same weekend traffic and noise into a cleaner-looking chart.
European retail numbers make the point concrete. IRP Commerce put the UK e-commerce conversion baseline at 1.68 percent in September 2025, while the broader UK average across sites sat near 3.4 percent against roughly 2.9 percent across all industries. Those gaps are small in absolute terms and enormous in sample-size terms. A shift from 1.68 to 1.85 percent is the kind of win that pays for a quarter of engineering, and it is invisible to a test that stops early.
| Question | Comfortable answer | Defensible answer |
|---|---|---|
| How many visitors? | Whatever the sprint allows | Compute from baseline and minimum detectable effect before launch |
| How long? | One week, like last time | Two to four weeks, covering full weekly cycles |
| When to stop? | When the chart turns green | At the pre-registered sample size |
| What counts as a win? | Any positive movement | Ninety-five percent confidence at eighty percent power |
| How many tests? | As many as possible, badly | About four a month, measured, with wins banked |
| What about a loss? | Delete the result | Keep it; it narrows the search space |
The peeking trap
Here is the uncomfortable part. The most damaging behavior in experimentation is not bad ideas; it is stopping early because the graph looks encouraging. Every fresh look at an accumulating result is another chance to catch a random upward blip and declare victory. By repeatedly checking, a team inflates the false-positive rate far beyond the advertised five percent, then ships a variant that does nothing and wonders why the lift evaporated in production.
The discipline is boring and specific: fix the sample size, fix the stopping rule, write both down before the first visitor arrives, and resist the urge to interpret partial data. A result that needs peeking to look significant is not a result.
Why a low win rate is healthy
If one in five tests wins, the program's output is governed by how many tests it can run cleanly. That is the counterintuitive part of the CXL dataset. A healthy program runs around four experiments a month at roughly a ten percent win rate, which sounds modest until the compounding is accounted for. Teams running ten or more a month report larger cumulative gains, not because each test is smarter, but because they buy more tickets with better odds than random.
This also reframes the losing four out of five. A clean negative result eliminates a branch of the decision tree. Collected over a year, those negatives form a map of what does not move the metric, and that map is worth more than a single lucky win that nobody can reproduce.
Where mini-programs change the math
A mini-program does not own its traffic; it borrows it from a host app, and host campaigns arrive in spikes rather than an even drip. A test that looks underpowered on an ordinary Tuesday may collect half its sample during a single host promotion, which is exactly the kind of mixture that corrupts a clean read. Segmenting results by traffic source is not optional in that environment.
A shared runtime that can run across several hosts gives a team a cleaner lever: expose the same experiment configuration to every host, then report results per host instead of blending them. The sample-size math stays the same, but the attribution gets honest. Run fewer tests, finish them properly, and let the host boundary do some of the statistical work.
Sources
- Conversion rate optimization guide — experimento.design — practical grounding in running disciplined experiments.
- A/B testing sample size — Convertize — how baseline and minimum detectable effect determine traffic.
- A/B testing calculator — OtterAB — the arithmetic behind significance and power.
- Statistical thresholds — experimento.design — reference for confidence and stopping rules.