
A badge disappears from a profile after a quiet policy change. Nothing in the build broke, no records went missing, and yet the support inbox fills with messages describing the disappearance in almost physical terms — as though something had been taken. Few findings in behavioral science have been absorbed into product folklore as completely as the claim that this sting runs roughly twice as strong as the pleasure of gaining the same badge. The number is entrenched enough to be used as a constant in retention models. It is also, depending on how the experiment is assembled, anywhere from 0.94 to 2.25.
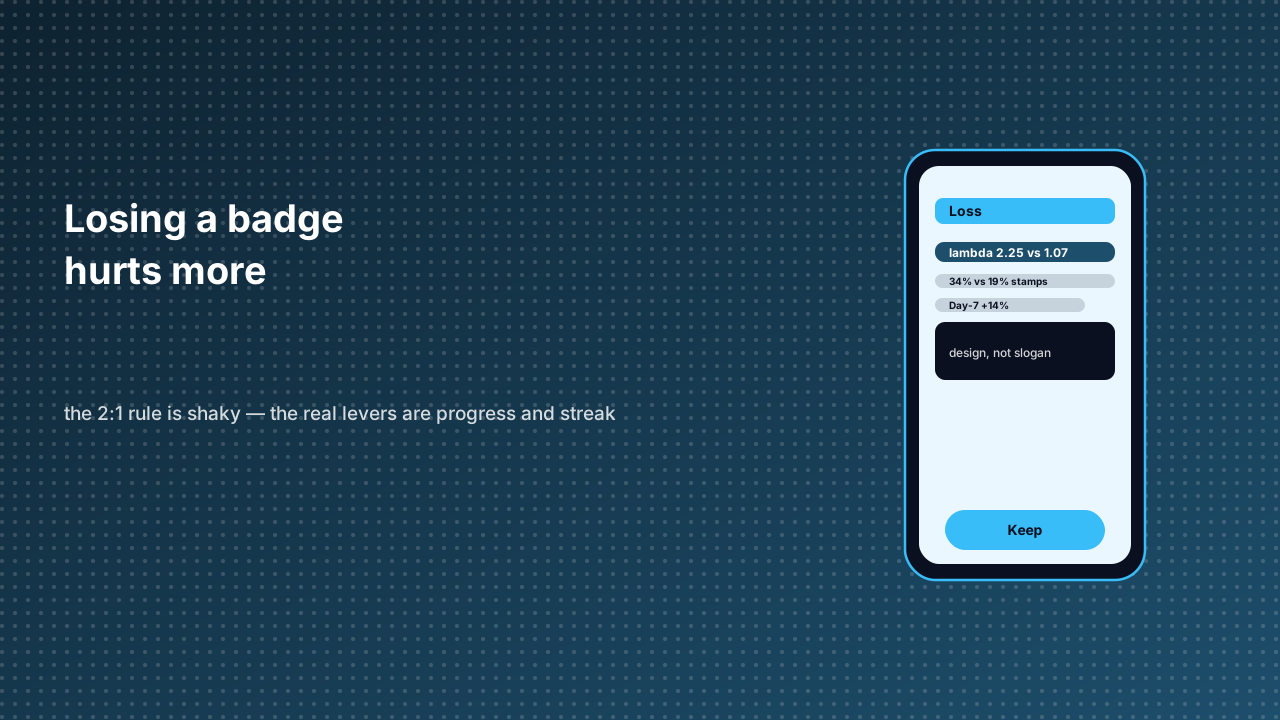
Three measurements sit behind that spread, and they are not alternate readings of one fact. Tversky and Kahneman (1992) gave the classic coefficient of about λ≈2.25, from choices framed as gains versus losses. A 2024 cross-disciplinary meta-analysis by Brown and colleagues (Journal of Economic Literature, 62(2)) pooled 150 papers and 607 estimates to a mean of λ=1.955 (95% CI 1.820–2.102), while its risk-choice subset came in at λ=1.31 (95% CI 1.10–1.53). Then Yechiam and Zeif (2025, Journal of Economic Psychology 107:102801) gathered 84 papers, 163 estimates and 149,218 participants, and when gains and losses were symmetric and presented in random order, the coefficient came out at λ=1.07 (95% CI 0.97–1.18) — not significantly different from 1, and 0.94 after correcting for publication bias. These are different measurements under different designs, not a single constant that can be swapped in as two-to-one.
The re-meta-analysis did find the familiar ratio, but only under specific conditions: when losses were smaller than gains, or when outcomes were sorted by magnitude rather than randomized. In other words, the two-to-one effect survives in the designs that produce it and dissolves in the ones meant to test it cleanly. That is a finding about design dependence, not a debunking, and the distinction matters. A team that cites 1.07 as proof that loss aversion is dead is doing the same kind of cherry-picking as a team that cites 2.25 as a law of nature.
Here is what the evidence supports when the question shifts from whether loss looms larger to which concrete mechanics hold attention:
| Anchor | Source and year | Design condition | Reported result | What the number does not establish |
|---|---|---|---|---|
| Classic coefficient | Tversky & Kahneman 1992 | Gains framed against losses | λ≈2.25 | A universal constant across contexts |
| Cross-disciplinary pool | Brown et al. 2024, JEL 62(2) | 150 papers, 607 estimates | Mean λ=1.955 (95% CI 1.820–2.102); risk-choice subset 1.31 | One clean experimental condition |
| Symmetric re-test | Yechiam & Zeif 2025, J. Economic Psychology 107:102801 | 84 papers, 163 estimates, n=149,218; random order | λ=1.07 (95% CI 0.97–1.18), 0.94 bias-corrected | That loss aversion never occurs |
| Stamp-card field test | Nunes & Drèze 2006, JCR | Ten cells, two pre-stamped versus eight blank; both need eight purchases | Completion 34% versus 19% | That progress cues are a loss effect |
| Streak wager | Duolingo, company A/B report | Game currency wagered on a seven-day streak | Day-7 retention +14% (relative, self-reported) | A baseline-independent lift |
The stamp-card result is the one most often filed under loss aversion, and that filing is imprecise. Customers started with two of ten cells already marked, so the remaining path looked shorter; both cards still required eight purchases. Completion rose from 19% to 34%, and a separate version got the pre-stamped group to finish about 15% faster. The mechanism is endowed progress and the goal-gradient effect — adjacent to loss aversion, not the same thing. It works by making the start feel advanced, not by threatening a penalty. Confusing the two leads teams to build threatening countdowns where a visible head start would have done less damage and more work.
Duolingo's published experiments are more direct about stakes. The Streak Wager asked learners to put game currency on the line for a seven-day streak and reported significant D1, D7 and D14 retention gains, with Day-7 up 14%; a Weekend Amulet was followed by a 4% rise in return visits a week later and a 5% drop in the chance of losing a streak. Those are company-reported, relative improvements with baselines undisclosed, and they describe a product already optimized around streaks. Mehr and colleagues (2025, OBHDP 187:104391) supply the cleaner causal evidence: across six preregistered experiments with 4,493 participants, escalating streak rewards beat higher but flat piece-rate pay on effort and persistence, and the driver was commitment to the goal rather than the size of the payoff. The setting was paid labor tasks, so extrapolation to a catalog of small programs should stay modest. On the less glamorous side, an Alchemer 2025 quick-service survey found 35% of customers naming points expiring too quickly as the leading complaint about loyalty programs — a correlate of how finely the threat of loss is calibrated, not proof that expiration drives churn.
The tradeoff is not between ethical and effective. Every mechanism above converts, sometimes dramatically, and pretending otherwise would be the comfortable lie. The question is what the conversion consumes. A goal gradient that makes eight purchases feel like six spends goodwill slowly; a wager that stakes currency spends it quickly, and learners who lose the bet do not always come back to place another. The literature cannot price that bill. What it can do is stop a team from hiding behind a constant that the best available synthesis no longer supports.
An organization running an open catalog has an unglamorous practical move available. Treat progress states, streak visibility and expiry rules as versioned, inspectable surfaces in the shared runtime rather than as copy tucked inside each third-party program. Then a team can compare a head-start design against a loss-framed one on the same footing, watch what happens after the reward stops, and roll back the variant that bought retention by making leaving feel expensive. Cross Mini App keeps those surfaces in the open catalog so the comparison can be reproduced by anyone auditing the directory, not just by the team that shipped the mechanic. The badge will still disappear someday. What matters is whether the path back is as easy to find as the path down.
Sources
- Brown et al. — Meta-analysis of loss aversion, Journal of Economic Literature 62(2) — 2024; 150 studies, 607 estimates, mean λ=1.955 and risk-choice subset 1.31.
- Yechiam & Zeif — Loss aversion re-examined, Journal of Economic Psychology 107:102801 — 2025; symmetric conditions yield λ=1.07, not significantly different from 1.
- ACCC — Australian Loyalty Schemes: A Loyalty and Reward Co report — loyalty-scheme complaints, including points expiring too quickly.
- Duolingo — How streaks keep learners committed — company-reported streak wager and amulet experiments.